What’s new this year
The NYC Department of Education has added more information to the School Quality Snapshot to help schools and communities understand equity, diversity, inclusion (EDI) in their school. This information can be used to identify gaps and start a dialogue about changes to address disparities. See below for a summary of changes to this year’s report. You can learn about additional changes to the Snapshot here: Data Explained: COVID-19 Changes.
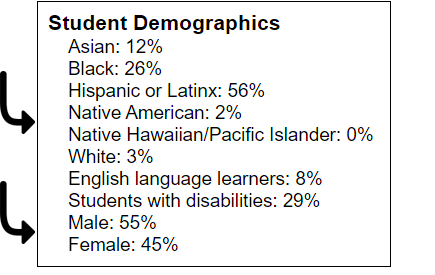
Student demographics – subgroups added
In the Student Demographics section on the School Info tab, you will find the overall student population breakdown by race/ethnicity, English language learner, students with disabilities, and gender. Three of these subgroups are new to this year’s reports to provide a more detailed view of the population: gender (male/female), Native American, and Native Hawaiian/Pacific Islander.
You will also find student demographic breakdowns in the Student Achievement tab.
Example: Performance on State Tests (elementary, middle, and K-8 schools only)
In the Performance on State Tests section, you will now see Native American and Native Hawaiian/Pacific Islander. Note: the results are shown as N/A this year since State tests were cancelled due to the COVID-19 pandemic. You can learn about this change and other changes due to the pandemic here: Data Explained: COVID-19 Changes.

Example: Graduation rate by subgroup (high schools and transfer schools only)
In the Graduation section you will now see gender, Native American, and Native Hawaiian/Pacific Islander. Note: you will see a red “Note” at the top of this section since Regents waivers may have impacted graduation rates. You can learn about this change and other changes due to the pandemic here: Data Explained: COVID-19 Changes.

Teacher demographics (new)
Teachers are an important part of the school community. In the Teacher Demographics section on the School Info tab, you will find the overall teacher population breakdown by race/ethnicity. You can use this information, along with student demographics, to understand the diversity of your school.

Surrounding demographics of the school (new)
In the Surrounding Demographics section on the School Info tab, you will find the school’s student demographics compared to the other public school students who live nearby (distance is listed in the chart). The chart also lists the race/ethnicity of students in the district (for elementary, middle, and K-8 schools) or borough (for high school, transfer schools, and D75). You can use this information to understand how your school’s demographics compare to the surrounding community.

DOE programs and State designations added
The DOE Programs and State Designations section on the School Info tab now includes information about DOE programs that the school participates in such as College Access for All. It also now includes the school’s most recent New York State accountability designation such as “Good Standing.”

Advanced courses and demographics (new)
ONLY for high schools
The Students in Advanced Courses section lists the number of students who are taking advanced courses at the school. The Advanced Courses Demographics section lists the race/ethnicity of students participating in advanced courses. You can use this information to understand what types of courses students are participating in and compare to the overall student population.

Seal of Biliteracy (new)
Only for high schools and transfer schools
The New York State Seal of Biliteracy (NYSSB) is an optional program offered by some high schools and transfer schools. Students may earn this seal as a diploma endorsement. This seal recognizes high school graduates who have attained a high level of proficiency in listening, speaking, reading, and writing in one or more languages, in addition to English. If students at a school earned the Seal of Biliteracy, you will see that listed in the College or Career Preparatory Courses and Exams section of the Student Achievement tab.

For additional information about how the DOE shares data about school quality, please review School Quality Reports and Resources. Return to the School Quality Snapshot.