The NYC Department of Education's School Quality Snapshot displays information to help schools and communities understand equity, diversity, and inclusion (EDI) in their school. This information can be used to identify gaps and start a dialogue about changes to address disparities. See below for a summary of where to look for EDI data on the Snapshot. Keep in mind that some sections of this year’s Snapshot have been adjusted to account for changes in school practices due to COVID-19.
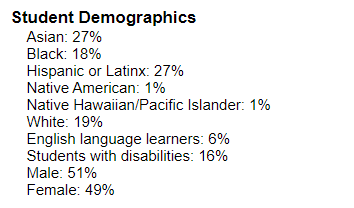
Student Demographics
On the School Info tab, student demographics are provided in two different places. Under General Information, you will find the overall student population breakdown by race/ethnicity, English language learners, students with disabilities, and gender.
In the Surrounding Demographics section on the School Info tab, you will find the school’s racial/ethnic demographics compared with that of other public-school students who live or go to school nearby.
- The dark blue bar shows the percentage of students from each racial/ethnic group at the school.
- The green bar shows the racial/ethnic breakdown of students in the school’s district (for elementary, middle, and K-8 schools) or borough (for high school, transfer schools, and D75 schools).
- The teal bar shows the racial/ethnic breakdown of public-school students who live near the school (the distance is displayed in the chart).
You can use this information to understand how your school’s demographics compare to the surrounding community.

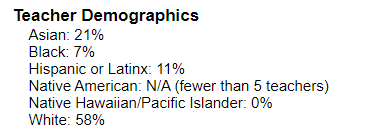
Teacher Demographics
Teachers are an important part of the school community. In the Teacher Demographics section on the School Info tab, you will find the overall teacher population breakdown by race/ethnicity. You can use this information, along with student demographics, to understand the diversity of your school.
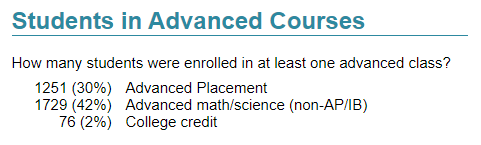
Advanced Courses
ONLY for high schools and transfer high schools
On the School Info tab, the Students in Advanced Courses section lists the number of students who are taking different types of advanced courses at the school. Next to each number is the percentage of students in the school who are enrolled in the listed courses.
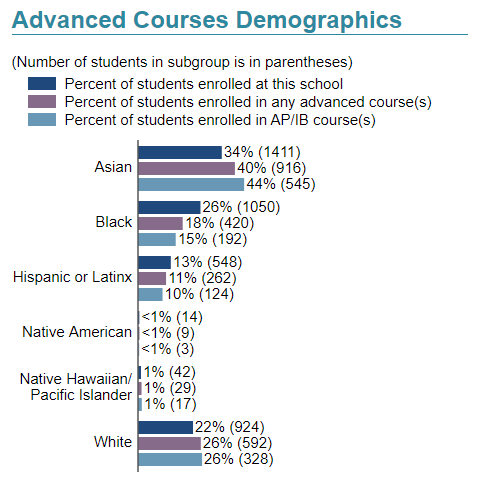
The Advanced Courses Demographics section lists the race/ethnicity of students participating in advanced courses.
- The dark blue bar shows the percentage of each racial/ethnic group at the school.
- The purple bar shows the percentage of each racial/ethnic group enrolled in any advanced course.
- The light blue bar shows the percentage of each racial/ethnic group enrolled in either Advanced Placement or International Baccalaureate courses.
You can use this information to understand what types of courses students are participating in and compare the percentage of students who are enrolled in advanced courses to the overall student population. If students are equitably enrolled in advanced courses, the three bars next to any given racial/ethnic group should be approximately equal in length. When looking at this data, it’s a good idea to be aware of the number of students included in the calculation. When a school has a small number of students enrolled in advanced or AP/IB courses, the movement of a single student in or out of a class can greatly impact the percentage for that student’s racial/ethnic group.
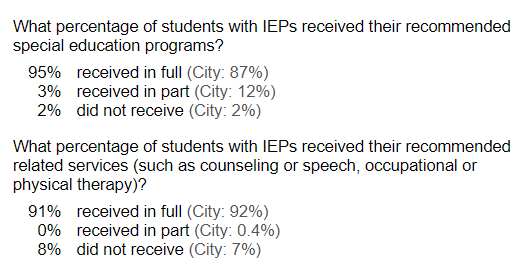
Students with Individualized Education Programs (IEPs)
On the Supportive Environment tab, look for the section titled Students with Individualized Education Programs (IEPs) (for District 75 schools, the section is titled Individualized Education Programs [IEPs]). The first part of this section shows how the school supports students with IEPs in learning alongside their general-education peers. Schools are rated on a scale of one to four, with one meaning “needs improvement”, two meaning “fair”, three meaning “good”, and four meaning “excellent.” Schools receive higher ratings when, over time, their students’ schedules include more time in class with general education students. More time with general education peers can result in higher scores on math and reading tests, fewer absences from school and other benefits.
Also in this section, you’ll see the percentage of students with IEPs who received all, some, or none of the programs and related services that are recommended on their IEPs. Special education programs include, for example, placement in ICT classes, SETSS, and Special Classes (SC). Related services include, for example, occupational therapy, physical therapy, and speech. Citywide percentages give context for the percentages of the individual school.
Test Scores and Graduation Rates
The Student Achievement tab displays certain data broken down by student demographic groups. This allows you to identify whether disparities exist between student groups.
Performance on State Tests (elementary, middle, and K-8 schools only)
For elementary, middle, and K-8 schools, there are two sections that display New York State test results: one under the English heading, and one under Math. In each section, the first value shows the performance of all students in the school. The bar chart below shows performance of students in different racial/ethnic groups, as well as English language learners, and students with disabilities. If students in each group scored equally well, all bars in the chart would be approximately the same length. Note: the results are shown as N/A this year since the participation in of the New York State tests was lower than usual due to the COVID-19 pandemic. You can learn about this and other changes to the Snapshot due to the pandemic by reading Data Explained: COVID-19 Changes.

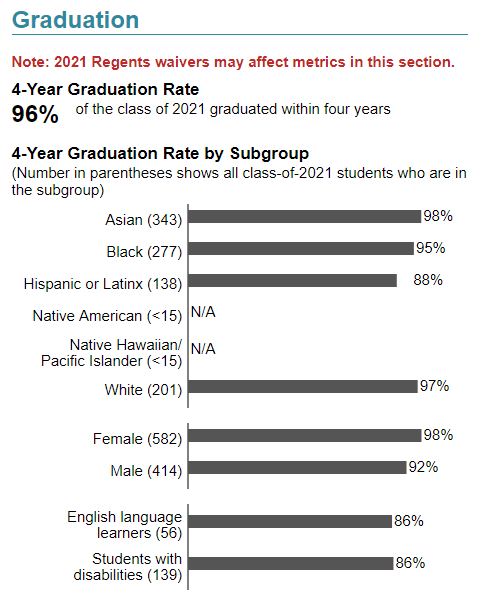
Graduation Rate (high schools and transfer high schools only)
For high schools and transfer high schools, the Snapshot displays graduation data. In the Graduation section the first value is the school’s graduation rate, including all students in the graduating cohort. The bar chart below shows the graduation rate of students in different racial/ethnic groups and genders, as well as English language learners and students with disabilities. If students in each group had similar graduation rates, all bars in the chart would be approximately the same length. Note: you will see a red “Note” at the top of this section since Regents exam waivers may have impacted graduation rates. You can learn about this and other changes to the School Quality Snapshot as a result of the pandemic by reading Data Explained: COVID-19 Changes.
NYC School Survey Results
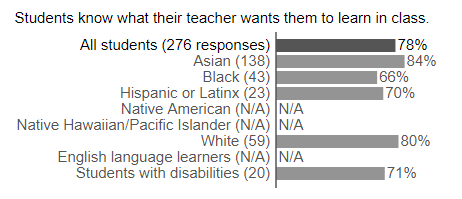
For the first time on the 2020-21 School Quality Snapshot, parent and student answers to NYC School Survey questions are broken out by racial/ethnic student groups, as well as English language learners and students with disabilities. There is a bar chart for each survey question displayed on the Snapshot. The first row of the bar chart shows the average answer for all students or parents in the school community. Below that, there is a row for each group. For parent questions, each parent’s answer is categorized based on the demographic characteristics of their child. In parentheses next to the name of each subgroup, the School Quality Snapshot displays the number of respondents in the group. When there are fewer than 5 students from a group enrolled at the school, the value in parentheses will be “N/A” and no bar will display. This is to protect the privacy of those students. When there are 5 or more students from the group in the school, but fewer than 5 of them responded to the survey question, the value in parentheses will be “<5”. If no students in the group responded to the question, there will be no bar. Keep in mind that when the number of respondents is very low, each respondent’s answer can have a great impact on the average for the group.
When reading the bar charts, look for cases in which the bars for various groups are different in length. This indicates that some groups answered very differently than others. These questions may help the school identify gaps and disparities in the experiences of different community members.
The teacher survey results are not reported by demographic groups, as teachers fill out the survey anonymously.
The School Quality Snapshot displays responses to a selection of questions from the NYC School Survey. View responses to all of the survey questions.
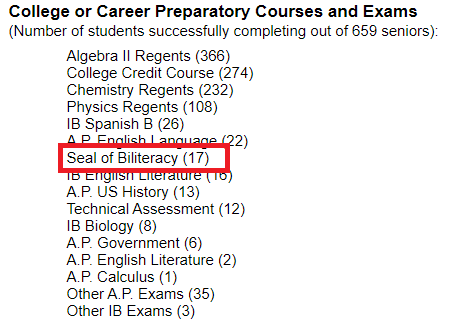
Seal of Biliteracy
Only for high schools and transfer schools
The New York State Seal of Biliteracy (NYSSB) is an optional program offered by some high schools and transfer schools. Students may earn this seal as a diploma endorsement. This seal recognizes high school graduates who have attained a high level of proficiency in listening, speaking, reading, and writing in one or more languages, in addition to English. If students at a school earned the Seal of Biliteracy, you will see that listed in the College or Career Preparatory Courses and Exams section of the Student Achievement tab.
For additional information about how the DOE shares data about school quality, please review School Quality Reports and Resources. Return to the School Quality Snapshot.